An Introduction to User Journey Map + free User Journey Map Templates
I do mentoring and coaching some startups at a WIDE (women in digital empowerment) event. The whole day was about helping them build a more user centered product and come up with a paper prototype of some of the features so that they can test it later. In this context, I gave them a small introduction to User Journey Maps, a tool that helps designers get a visual representation of the whole experience users have with a product or a service. This article is a transcript of this introduction. I will guide you step by step on how to build a user journey map for your product or service. At the end of the article you will find the slides but also two free templates to help your build user journey maps for your own projects.
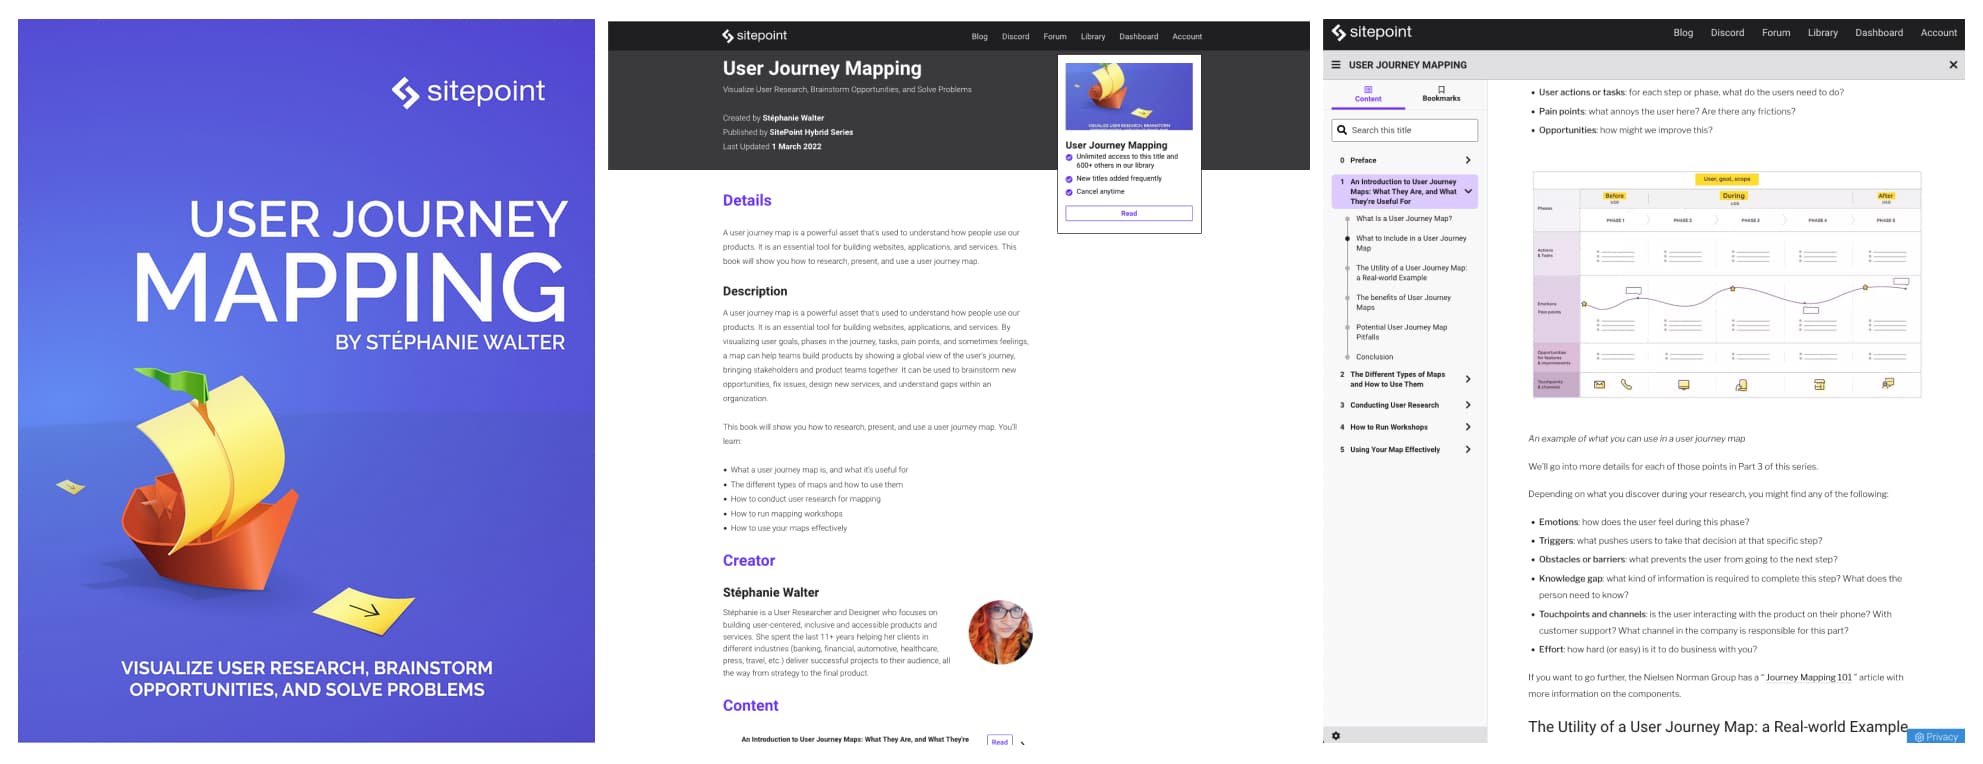
Update: My User Journey Mapping Ebook
What is a User Journey Map and why is it useful?
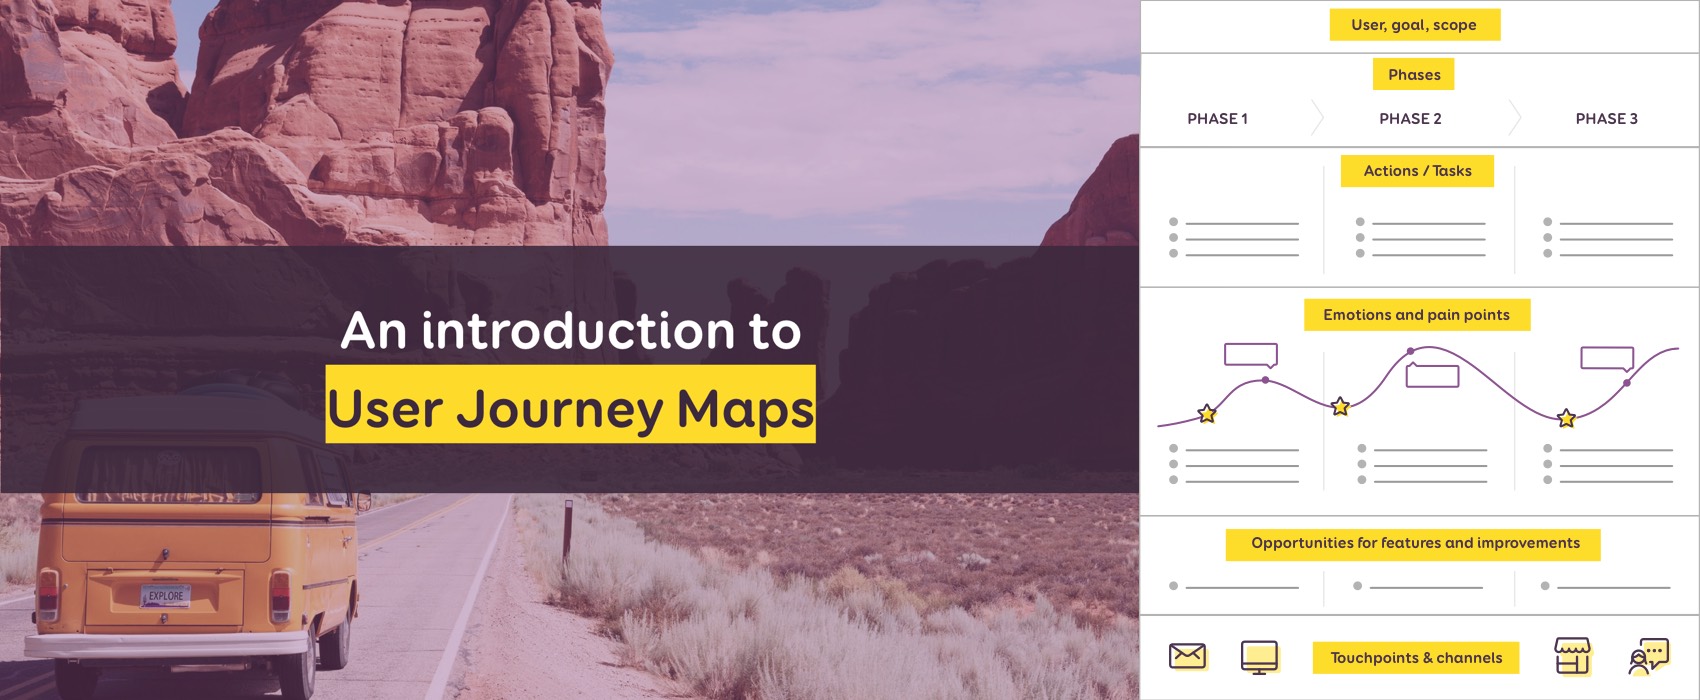
A user journey map will help visualize and document the experience a user has as she/he uses a product or a service. It presents this experience in in a chronological way, usually as a visual timeline. A user journey map will list the different phases and actions users will go through to accomplish their goals.
The journey might start way before users interact with your specific site or mobile app. It usually also goes beyond or after the experience with the digital part of your service. For example: if you have an e-commerce website, the experience doesn’t stop after the user paid the product. You want to include the shipping in the whole experience and even the support if the product isn’t delivered. This will let you identify different touch points users will have with your product and service, beyond your website and app.
User Journey Maps are also a great tool to identify different pain points and unmet user needs. Some user journey maps also include the emotions and motivations of the users. What do they think, what they feel during the experience? This will help identify opportunities to solve those pain points and meet those unmet user needs.
This is the basic information. But you can add anything that makes sense to your product and organisation: internal ownership, processes, etc.
It’s also a great tool to share a visual understanding of user’s steps with the whole team, from developers to stakeholders. It will help you, them, take better product decisions, prioritize a roadmap, etc.
The car additional repairs example
In the presentation I give the example of one of the services I was working on. The service lets car repair mechanics communicate extra repairs with their end customers. Let’s say you bring your car to the garage for a break problem. While fixing the breaks, the mechanics discover there’s an extra repair that needs to be done on the engine. The front desk of the car dealership has to call the client to ask them if they accept this extra repair. If the client doesn’t reply quickly for various reasons, the car stays immobilized for a long time.
The solution I was working on lets car mechanics take small videos and pictures of the extra repairs. The service desk of the car dealership can add extra documents (like price offers). They client then gets an SMS (or email) with a link to the videos, the pictures and the price offer. They can then accept (or refuse) the extra repairs.
We built a mobile app for the mechanics so that they can take pictures and videos of the cars. We interviewed them in the workshops. Based on those interviews, we mapped their entire user journey map.
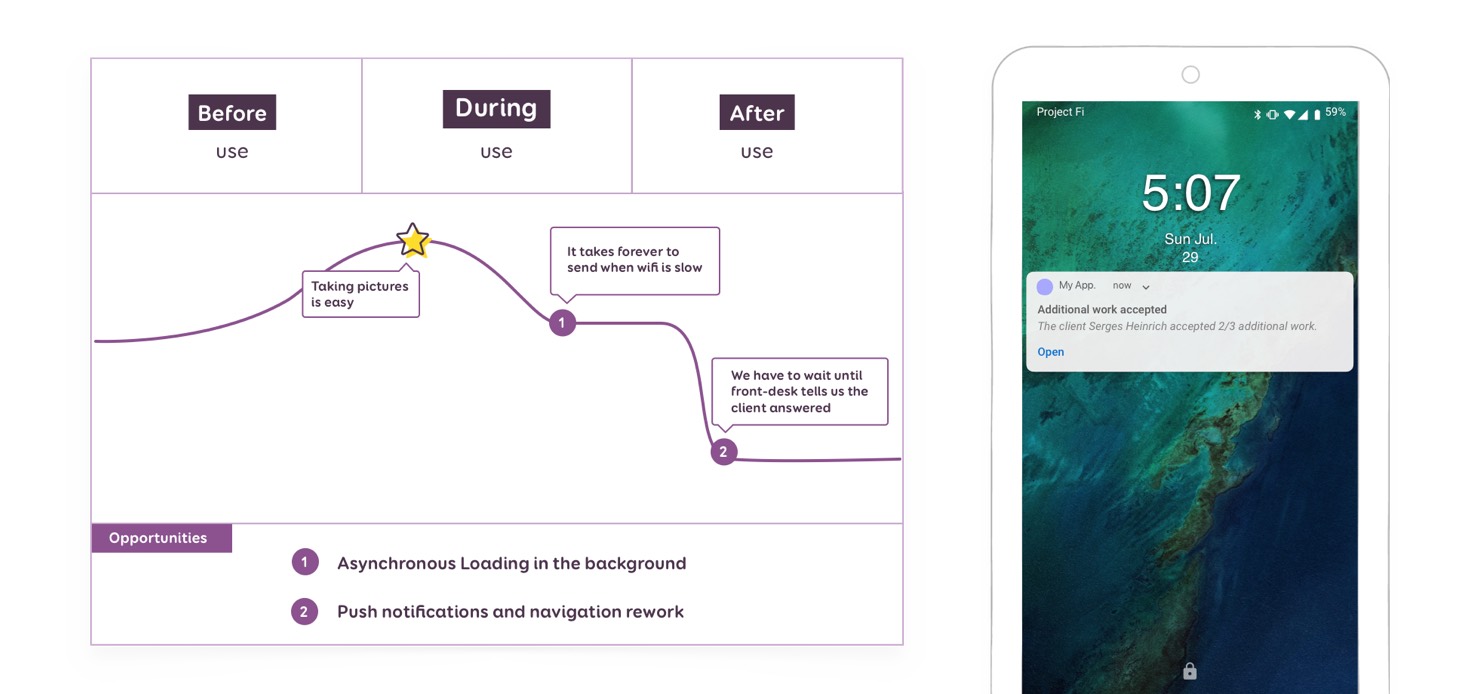
The experience within the app was great and they were quite satisfied with it. But we identified 2 pain points in this journey:
- Sometimes the wifi is not good in workshops so it takes forever to send the pictures and videos once they want to send it to clients
- After those were sent to the client, the mechanics have to wait for the front-desk people to tell them if the client replied or not. Some smart mechanics found a workaround for that: they refreshed the history every X minute to see if the status of the client went from “sent” to “answered”.
Those 2 pain points are opportunities for product features:
- Sending the pictures in the background: this way they can work on a new car and take new pictures even if the previous ones are not all sent yet
- Adding push notifications in the app to inform mechanics that the client answered
How to build a User Journey Map
This part focuses on building a simple version of the journey map that was targeted towards start-ups. As mentioned before, there’s a lot of other parts you can add to the journey.
1. Do your user research
To build this kind of map, you need to gather information about your users. How to conduct user research was of the scope of this presentation. There’s a lot of different direct and indirect ways you can gather information about your users. You can conduct face to face or remote user interviews, street guerrilla interviews. You can build online surveys, take a look at customer support logs (or talking to your customer support people), web analytics. You can do social medias monitoring, etc.
In the example I gave before, we went directly in car dealerships and observed and talked to a few mechanics about how they were using our mobile app.
2. Define user, goal and scope of the map
Based on your users you first need to define who your user is for this map. Identifying personas (or marketing target audience) will help. The “topic” of your map will be a user goal.
For example: if we build a user journey map for travel agencies, the goal could be “the user wants to book a 2 weeks trip for their holidays this summer”.
Last but not least, defining the scope is quite important. You can do a super high-level helicopter view map of a whole global journey. But you can also build super detailed zoomed in journey map for a specific part of a bigger journey. Defining the level of detail and scope at the beginning is important to get everyone building the map on the same page. You could map the “current” journey as it is to identify pain points, but you can also map the “ideal journey” as you want it to be to help you drive your roadmap.
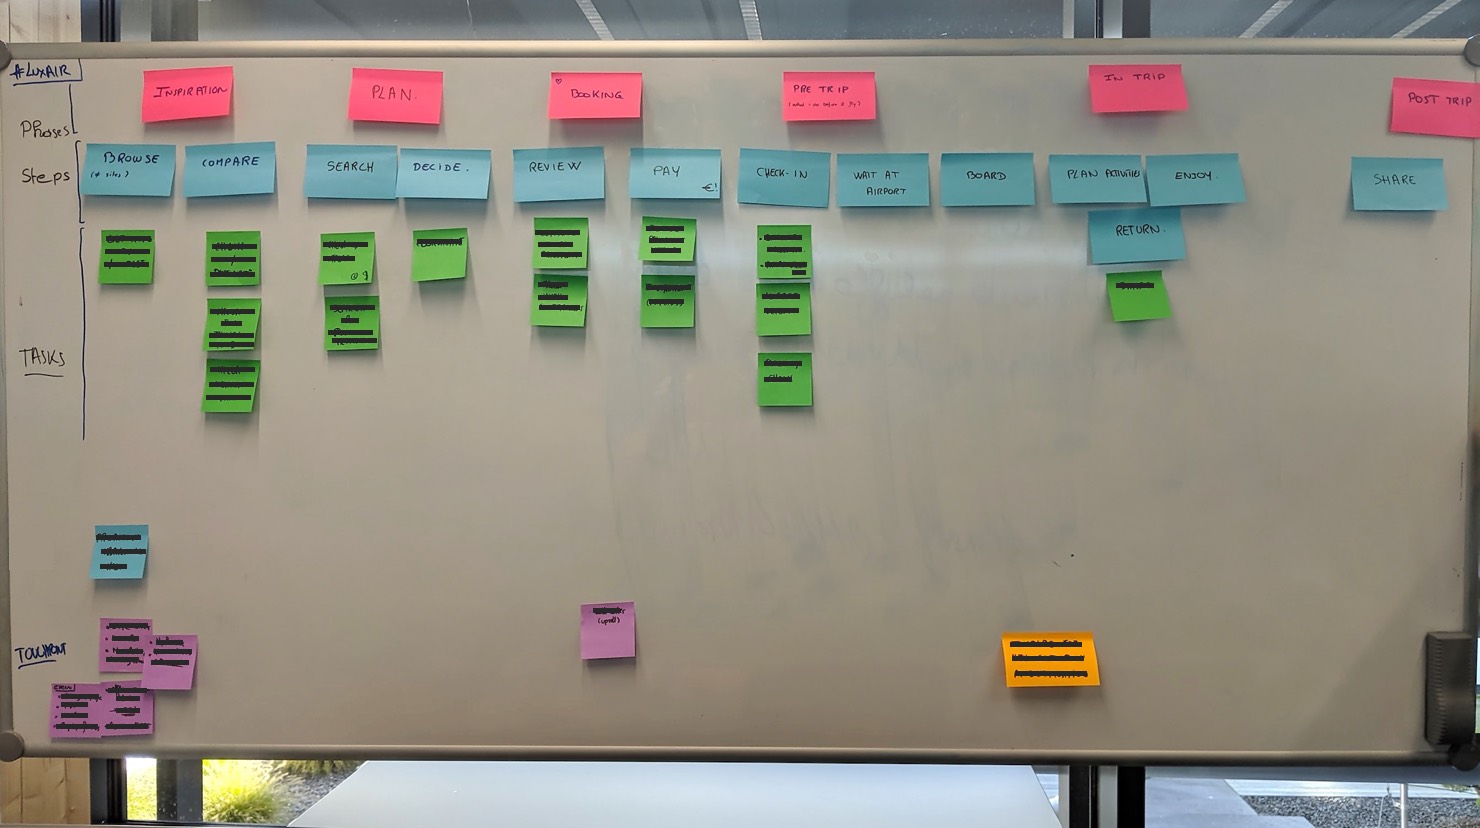
3. Identify Journey phases
Identify the different high-level phases of the process a user goes through. Write them down as phases in chronological order. Don’t forget about what happens before and after they use your product if you are building a digital product.
If I take the example of my travel agency user, the phases could be getting inspired, planning the trip, booking the trip, going on the trip, coming back from the trip.
4. List actions and tasks
For each phase, list the detailed actions and tasks the user goes through in this particular phase. This list is usually a granular step by step list. Depending on the scope of your map it can be more or less detailed.
In the planning phase of for booking a trip for example:
- go to a comparator site
- enter destination and dates
- enter multiple destinations for the same date
- enter multiple dates for the same destination
- etc.
5. Understand emotions and pain points
How does the user feel, what do they think during each of those phases? What are the nice positive emotions, the “aha” moments, the delightful part of the experience? What are their pain points, the frustration, what bothers them, annoys them?
In the planning phase of for booking a trip for example:
- Stress: the users wants to get the best price possible, but they change all the time.
- Confusion: too many offers and the price change all the time, why do they keep changing?
- Pressure and fear of missing out: the user is afraid that they might lose this “good price” they found it they book tomorrow
6. Find opportunities
Until now we used our user research to fill the map. Now it’s brainstorming time. Once you know what frustrates, annoys and bothers users, you can start thinking about how to make things better and the opportunities. How might we turn those pain points into opportunities to build and improve our product and service? Are there any user needs that the product doesn’t meet yet that could be met? How could your product meet those user needs?
If you build a map for an existing product/service, you can already start to think about ownership. Which department within your company will have the ownership on those opportunities? Who’s responsible to meet those needs?
In my booking example: the company could offer a“ save my price” button that lets user pay a small fee but guarantees this price for 48 hours.
7. List touchpoints and channels
What are the different touch points the users will have with my product and service at the different stages of this process? Hint: those might not only be digital touchpoints!
Identifying those is important if you want to build a consistent user experience and brand identify across different channels.
In the example of my booking: it could be the website, the mobile app, but it could also be third part aggregators websites of even physical agencies (then you could imagine building a whole journey map for the experience in the agencies)
It’s an iterative exercise
Those were the different elements to help you build a user journey map. Note that even if this was a “step by step” kind of list, most of the time, you will not be able to fill this step by step.
That’s why I prefer to do this kind of exercise with post-its. I can re-arrange and re-organize them, move them, add steps and actions if needed. If I am working remotely, I do this using a miro board.
That’s also why building a user journey map is usually a team exercise. Involve your design team to help you sort the data and build the map. You could also involve stakeholders and other departments like business people, marketing (and sometimes developers) to review the map.
WARNING: When I say team exercise, I don’t mean “ask a team of random people to imagine the perfect user flow”. I mean “gather your research and data and analyse this together with a team of designers and UXers”. You are looking for patterns in your data to understand those journeys. (You can look at quantitative analysis methods and specifically “affinity diagram”)
Clean up, share, update.
Once you are finished with the Post-it draft version of your map, you usually want to turn this into a nice visual artefact. If you have visual designers in your teams, now is the time for them to have fun. Or you can simply find some free templates online.
The main idea is: clean up the map and turn it into an artefact that you can share with the teams to help them work on your product.
And of course, this is never finished. After a while the product changes and you will have to update the map to include new user research findings, pain points and opportunities.
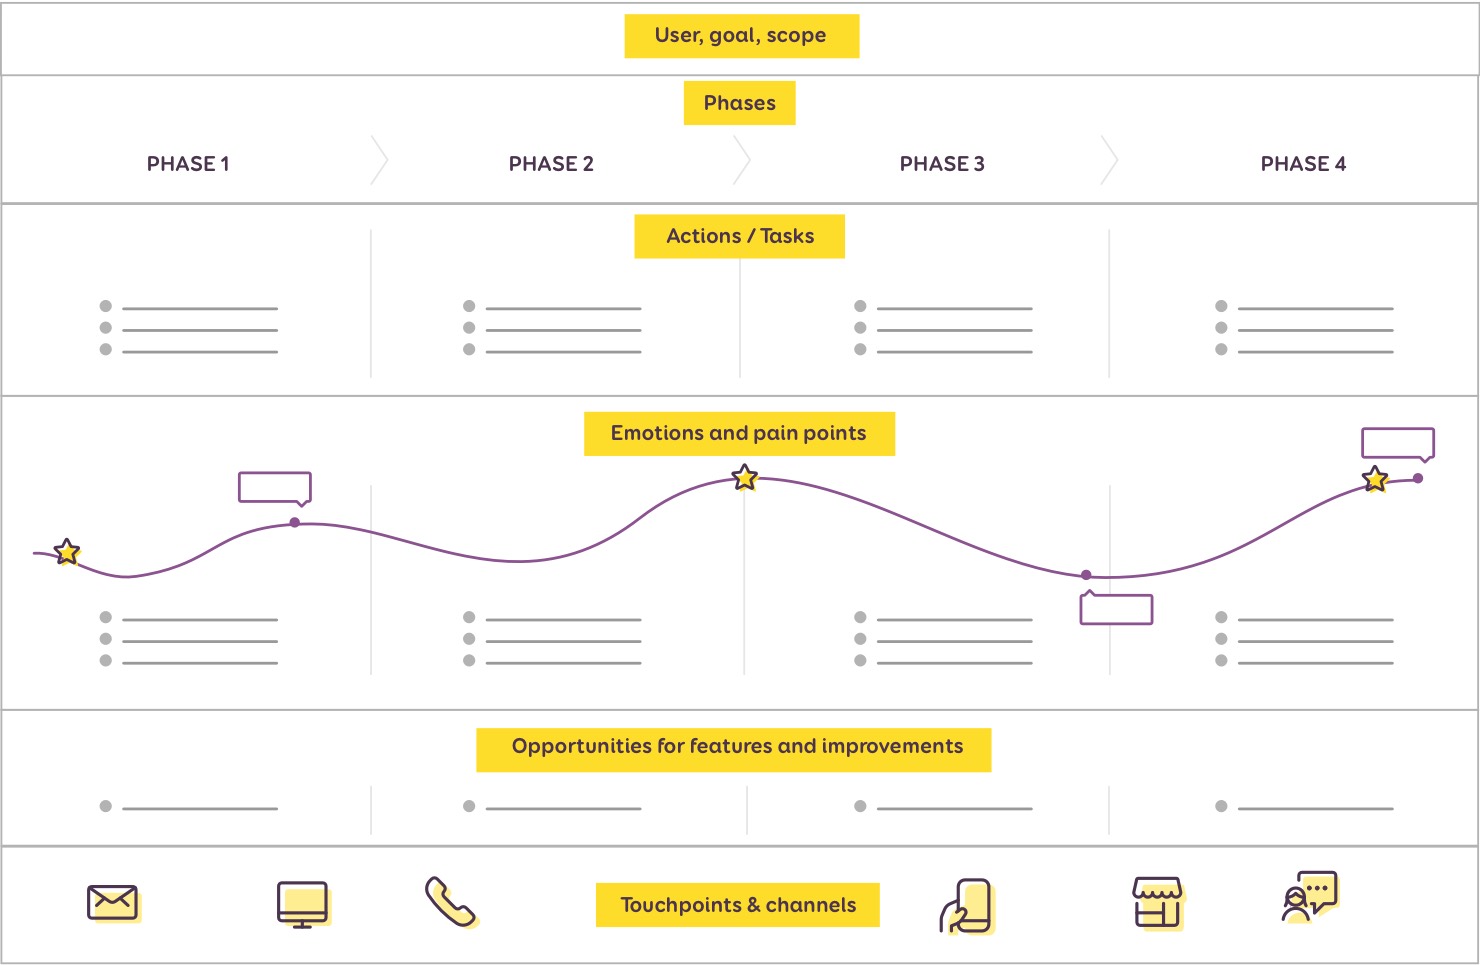
Free User Journey PDF and Miro templates
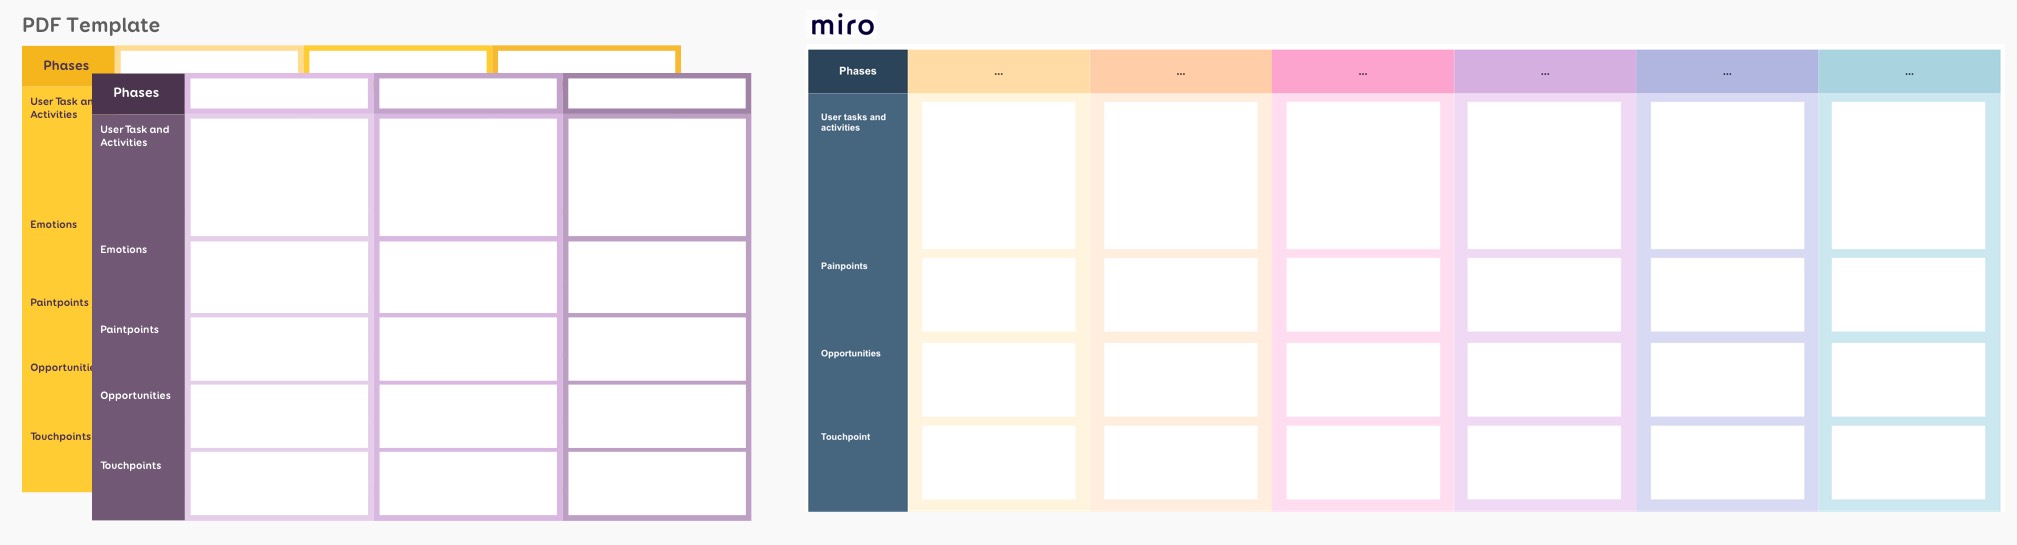 You can also download the free user journey map template I created for my workshops. Milanote also offers an interesting user journey template that focuses on key touchpoints in a visual way.
Also, I created a user journey map as miro template. Feel free to use it for your projects.
Miro User Journey Map Template
Going further
Some “how to” on UX methods websites:
- Journey mapping – 18f.gov
- Journey Mapping – Opendesignkit
- Design Kit – Journey Mapping
- Journey Map – Service Design Tools
Some articles on user (and customer) journey maps